This is the 2022 update of the System Security Circus.
The dataset now contains 5648 papers written by 9922 unique authors from 1392 affiliations located in 63 different countries.
Submissions
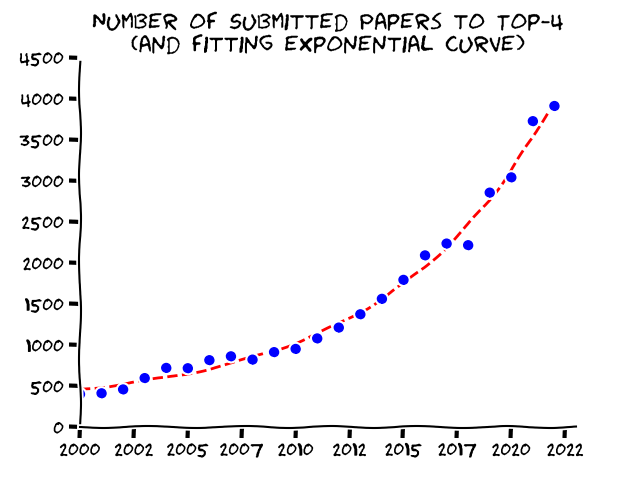
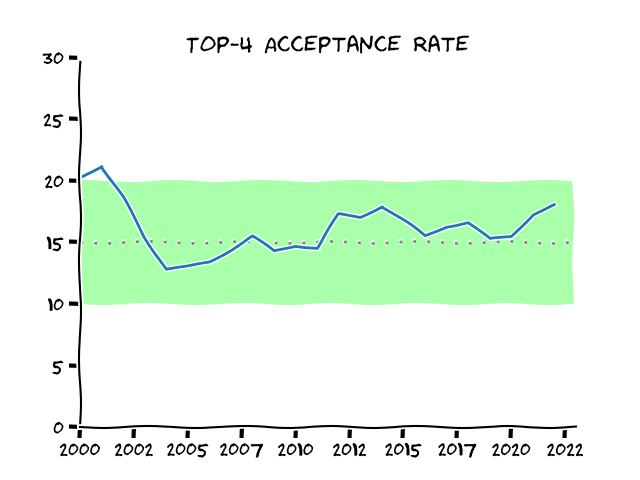
In 2022, there were 3908 papers submitted to the TOP4 (+5% from 2021). As conferences grew accordingly, the acceptance rate was not affected.
We reached 3K submissions for the first time in 2020, and we are now already at 4K. If the number of submissions keeps increasing at this exponential rate, we will surpass 5K in 2024.
Program Committees
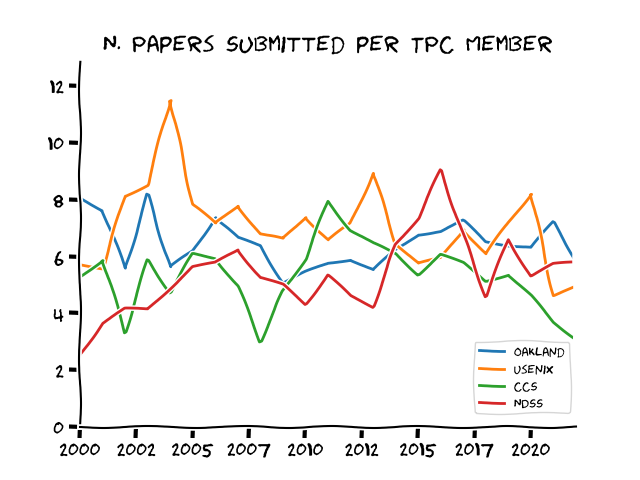
The number of submissions per TPC member reached a minimum for the second year in a row: there is now one reviewer every 4.5 submissions, roughly half of the 8.8 we reached in 2005.
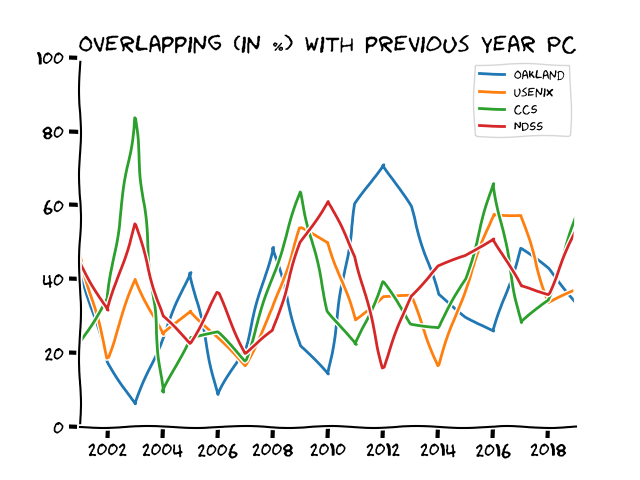
47 people served in at least three of the four conferences, and 8 served in all of them. While it is an admirable commitment, this is an enormous amount of work (I did that mistake few times myself) that has negative consequences on the ability to do a good and timely job, without mentioning the impact on the mental health.
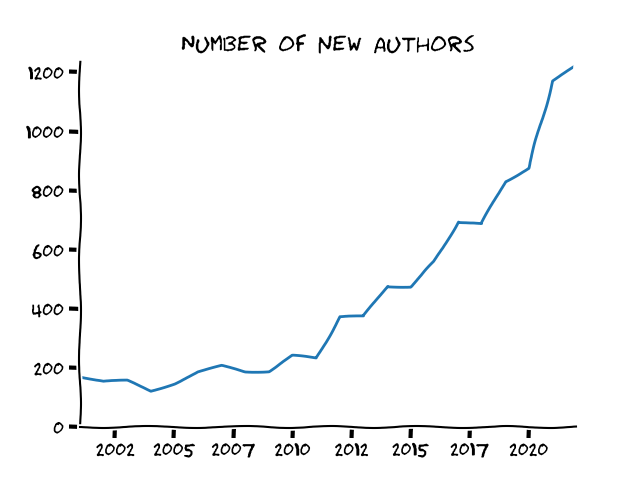
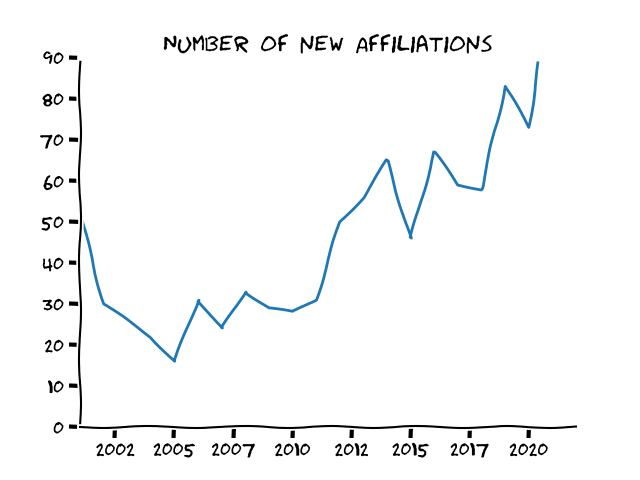
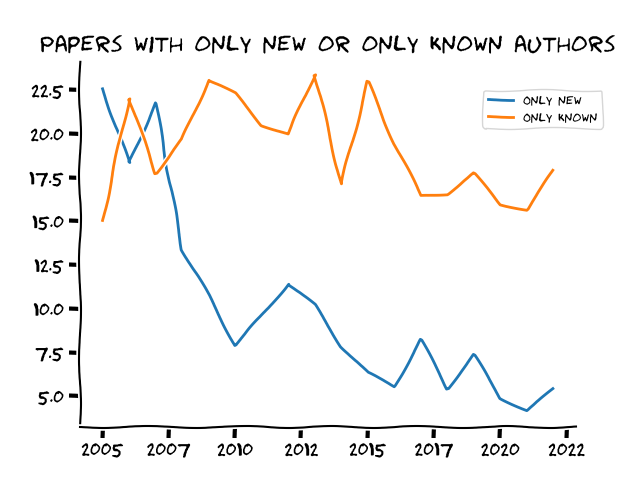
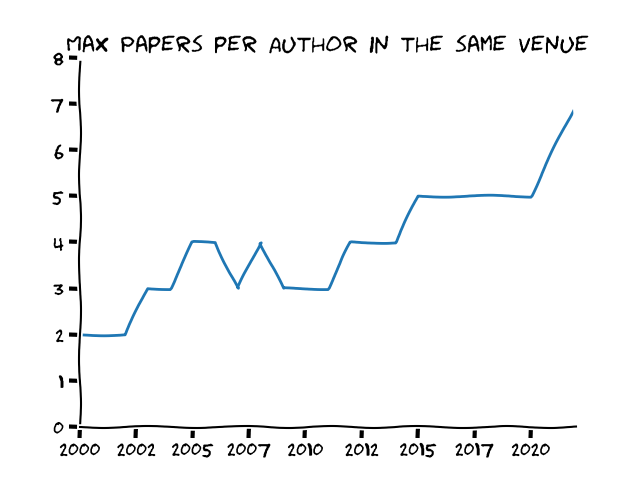
Authors & Affiliations
While the graphs below show that the community is growing, the fraction of accepted papers in which all authors are new (i.e., they never published in the Top4 in the past) keeps decreasing. Now the percentage is down to only 4%. At the same time, the number of papers accepted with the same author keeps increasing (i.e., the same professors publish more and more papers per year).
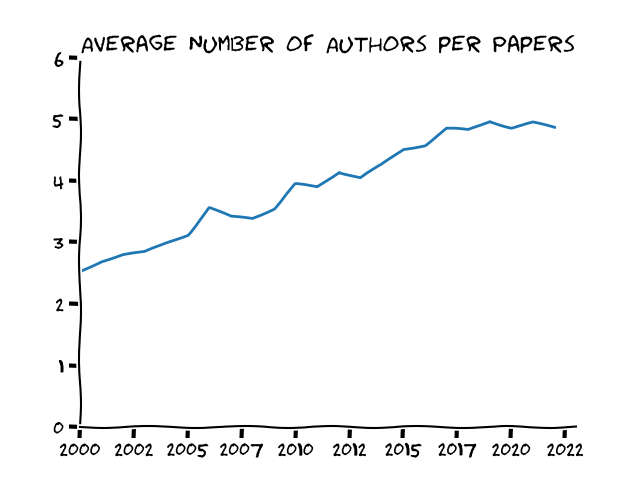
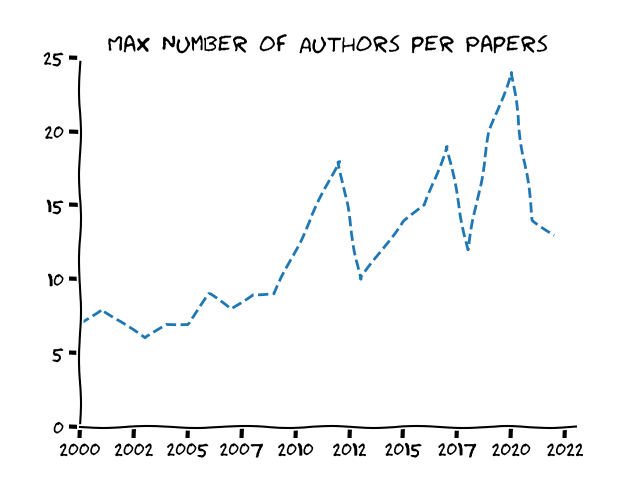
Authors per Paper
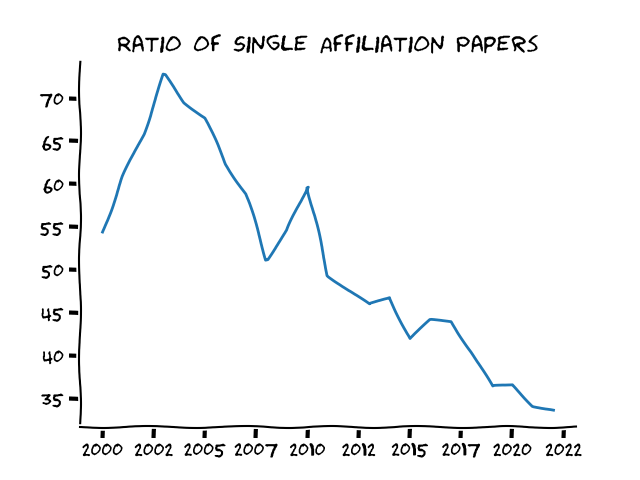
Collaborations among Countries
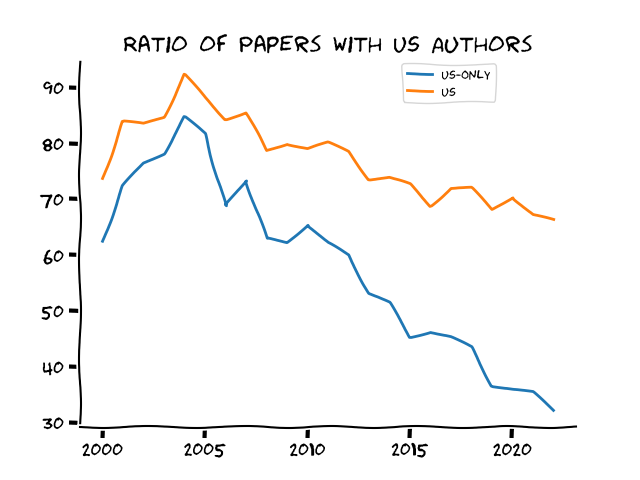
Research is getting more and more a collaborative effort, as shown by the stunning trend of the graphs below. Today only one third of the accepted papers come from a single institution, and roughly half of them involve researchers from different countries.
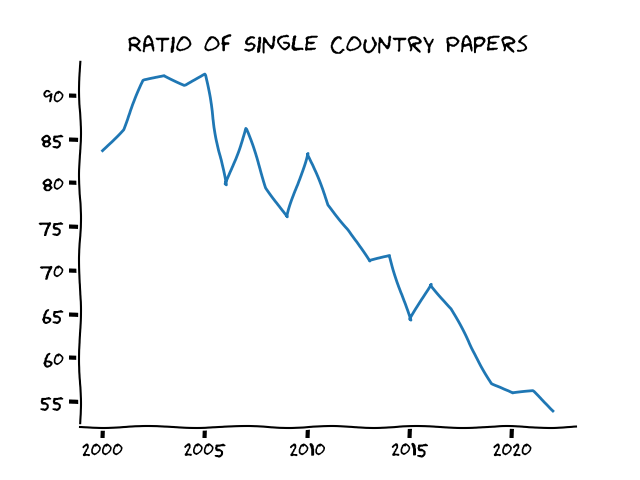
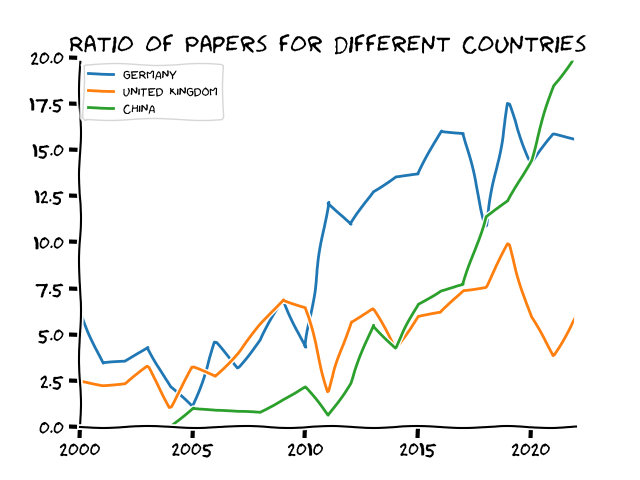
US-based researchers are still involved in roughly 70% of the accepted papers, but the number is declining and other countries (notably China) are growing fast. UK instead decreased for the second year in a row (a fluctuation or a sign of Brexit?).
CURRENT VERSION: 8.0.1
(major version changes when I add new stats or new venues, minor if stats are modified,
build number keeps track of typos and spellings mistakes)